HDPsyChart 7.x World's #1 Psychrometric Chart Software
The HDPsyChart Version 7.x Windows desktop application is now part of Carmel's library of HVAC software after acquiring the assets of Hands Down Software. HDPsyChart is the most popular desktop psychrometric chart software tool in the world with 20,000+ users. This tool allows for complete psychrometric and process analysis, all graphically displayed on beautiful charts with unmatched accuracy. It also provides a professional state point and process report detailing all of the psychrometric and process values. Both IP and SI units are fully supported by HDPsyChart.
Are you interested in a branded or white-labelled version of HDPsyChart? Over 400 companies world-wide have white-labelled our software which includes custom logo, coloring, and more. Click here for more information.
There are several versions of the HDPsyChart available to you. The Pro version is the most comprehensive version.
The Standard version includes a subset of the Pro version functionality and is great for basic psych chart plotting.
The OEM version is the same as the Pro version but includes your company's logo and color-scheme.
We also offer the Akton Psychrometric Chart version (from the acquisition of Akton Associates a while ago) that is the same as the Pro version but includes much lower and higher
temperature ranges. Click here for more information.
See the chart below for specific differences between the 3 versions.
| Works on 32- and 64-bit machines | |||
| Allows for full psych chart customization | |||
| Includes allowances for elevation from 0 to 12000 ft | |||
| Includes 20+ additional HVAC calc programs listed here | |||
| Allows you to export the chart to PDF | |||
| Allows you to create Excel outputs listing all points and processes | |||
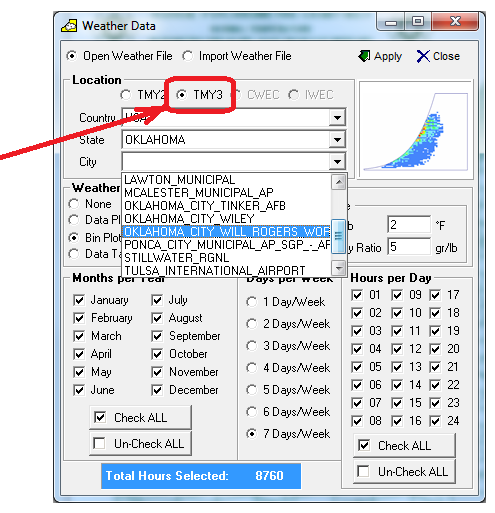
| Allows you access to ASHRAE, TMY2, and TMY3 weather data for plotting bin weather data and more | |||
| Includes your company logo and color-scheme |
Process Analysis Capabilities
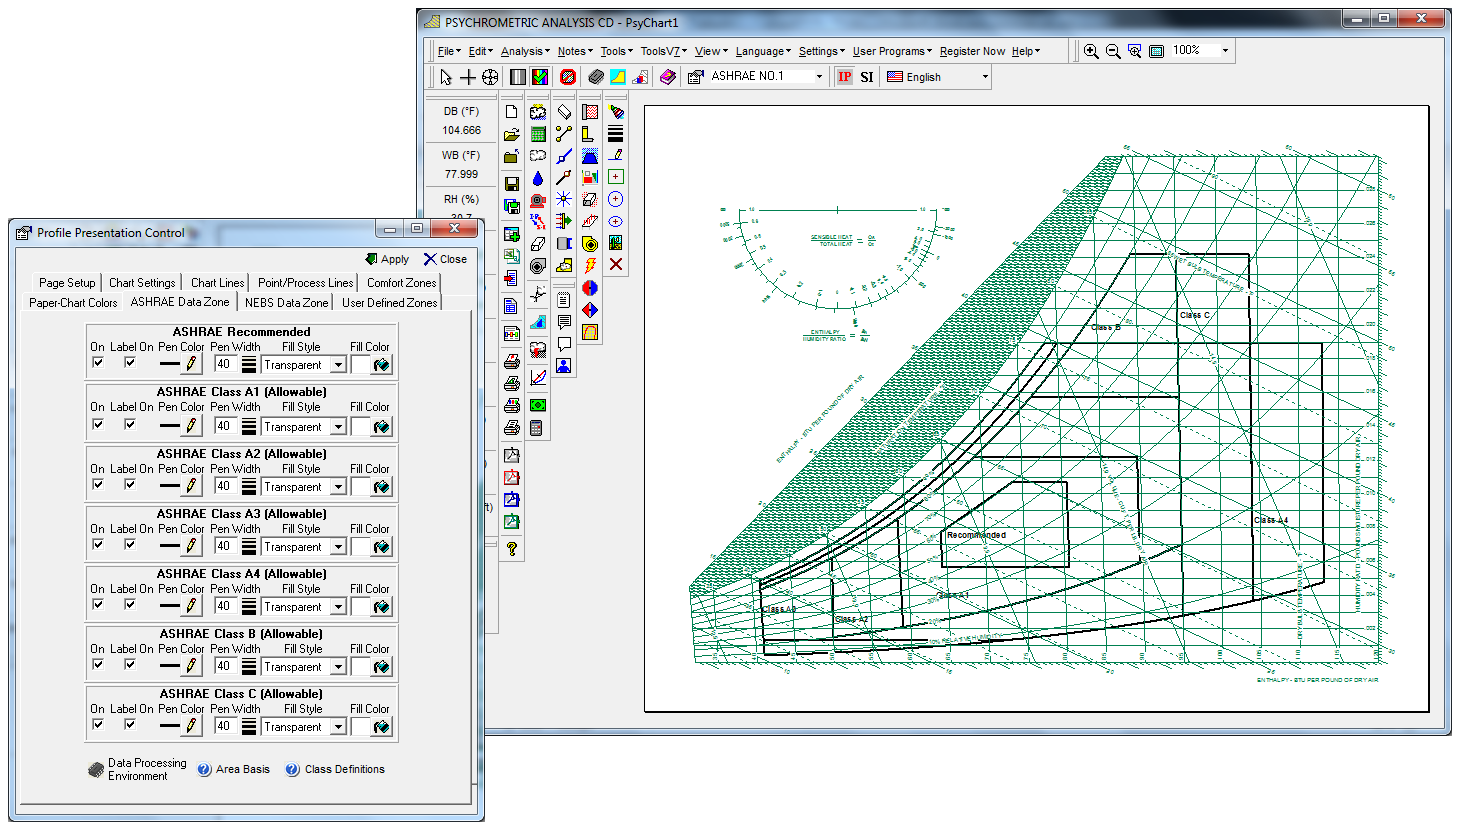
- ASHRAE Datacenter Zones to 2011 Thermal Guidelines
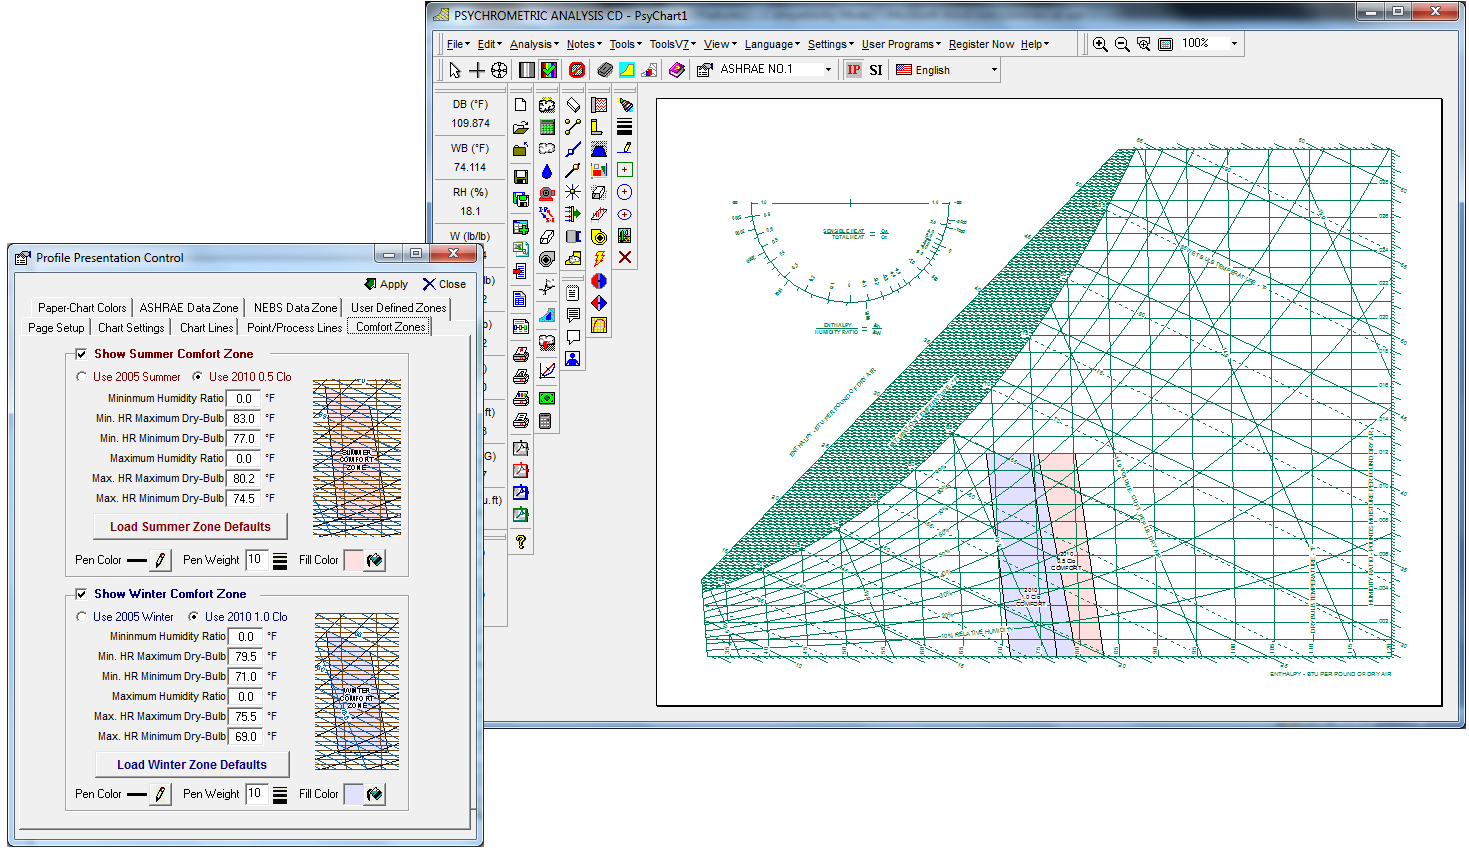
- ASHRAE 2010 Comfort Zones
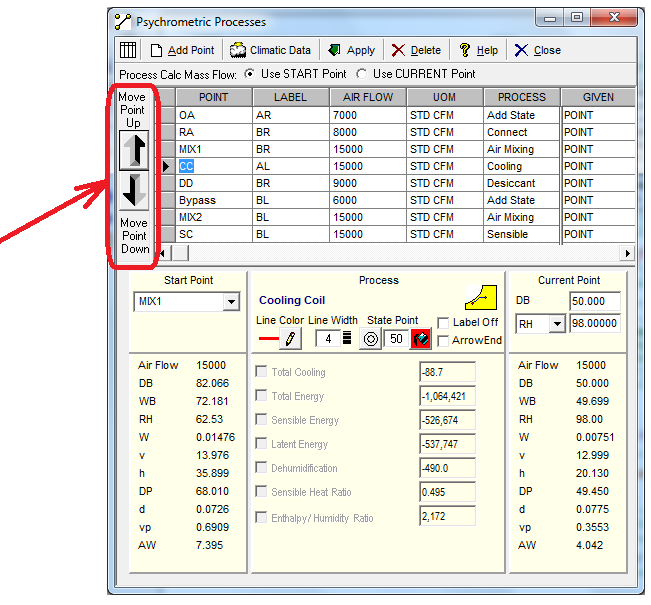
- Re-arrange or Re-order Points on the Fly with One Button Click
- TMY2 & TMY3 Bin Weather USA Locations Added
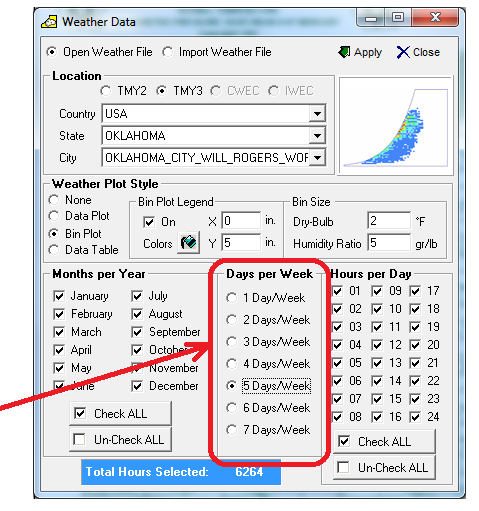
- Ability to Select Days Per Week for Bin Weather Data & Plots
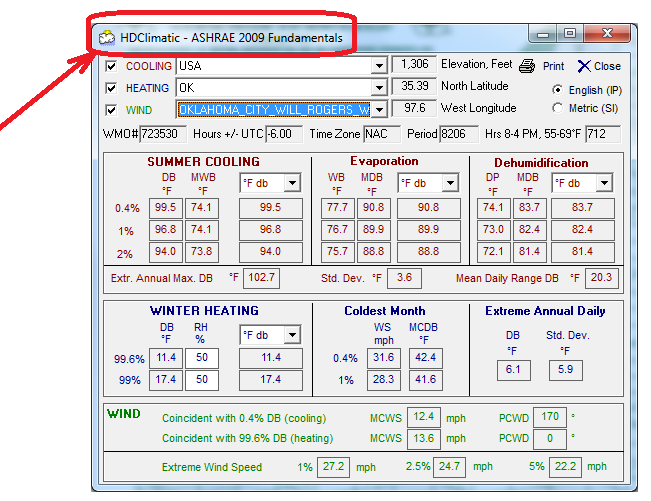
- HDClimatic data from 2009 ASHRAE Fundamentals
- Import Your Own Weather Data File Locations into the Chart
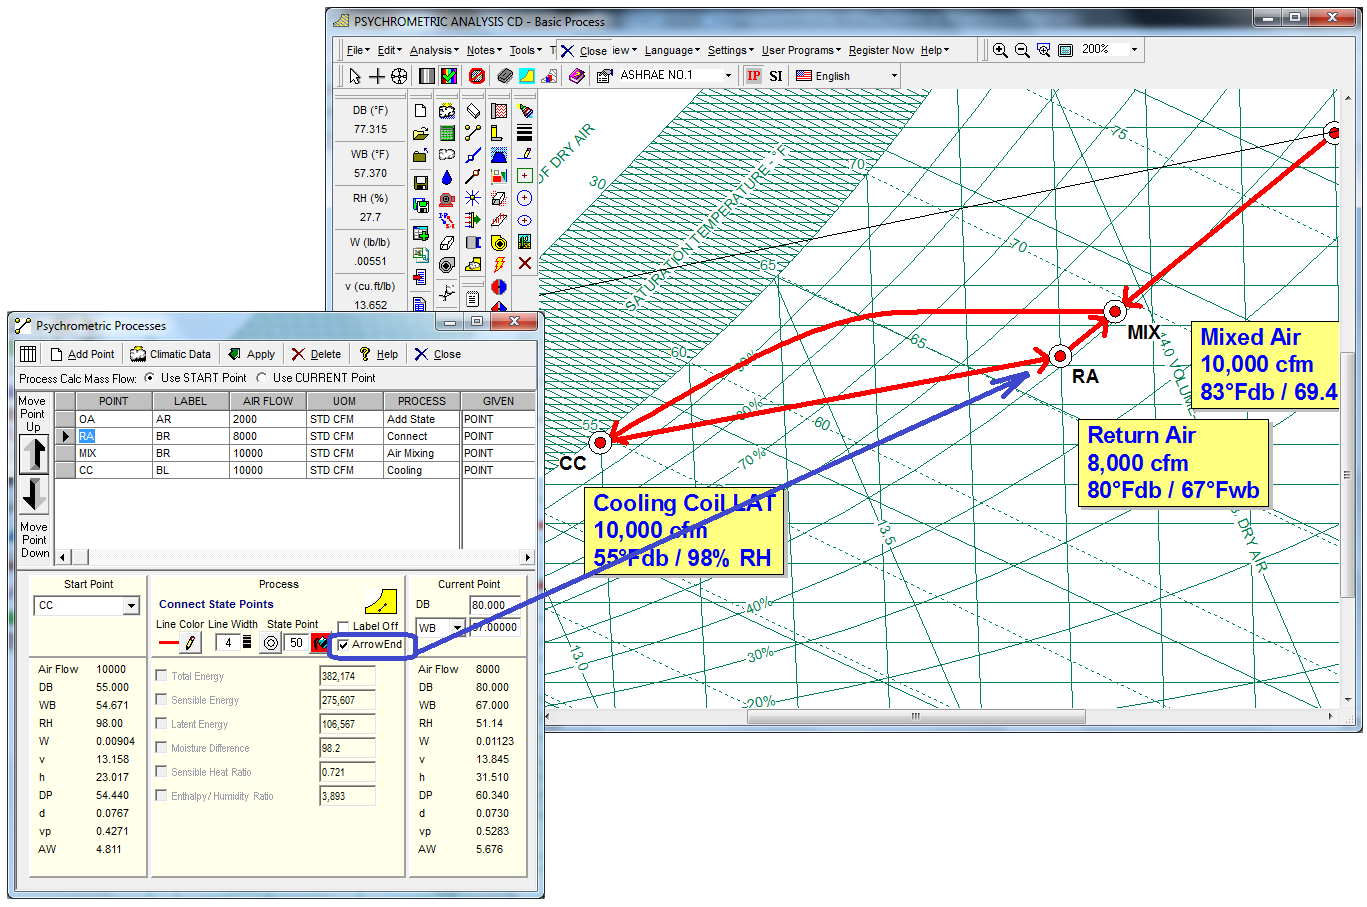
- Optional Process Directional Arrowheads on Process Lines
- Ability to Print-All or PDF-All (Psy+Flow+Report) into ONE File
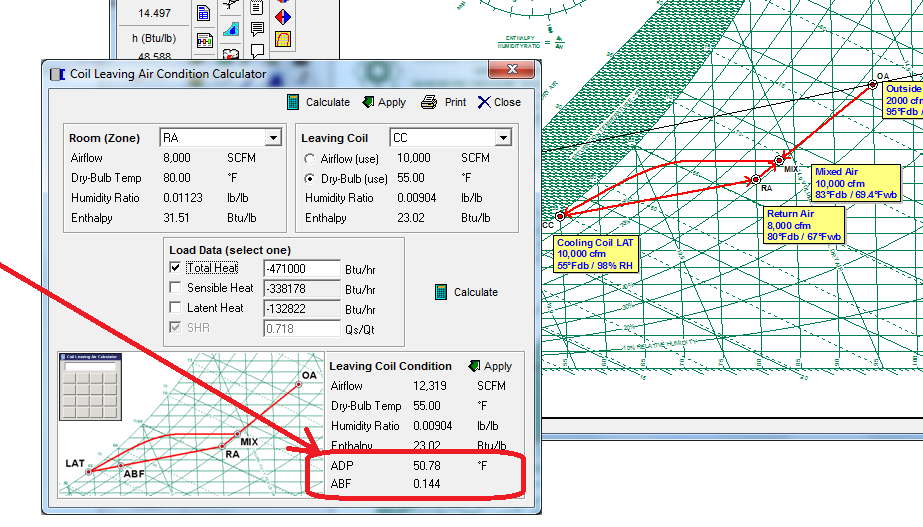
- Cooling Coil Apparatus Dew Point (ADP) Calculator
- Cooling Coil Air Bypass Factor (ABF) Calculator
- Air Mixing Algorithm with both Mass and Energy Balance
- Auto Flow Chart Diagram
- Individual Process Line Color Control
- Individual Point Color, Shape and Size Control
- Winter "V" Air Mixing Capability with Condensation
- Fog Region Property Display
- Constant h, WB, HR, DB Line Control
Presentation Control
- Ability to Turn Logo On & Off, for ASHRAE Meeting “Generic” Presentations
- Customize Psychrometric Charts with your own Colors
- Change Any Chart Property Lines to Any Color You Choose
- Change Any Chart Property Lines to Any Line Type You Choose
- Change Any Chart Property Lines to Any Line Thickness You Choose
- User-Defined Custom Area Shading right on the Chart
- Updated ASHRAE 2010 Comfort Zones
- ASHRAE Class 1 through 4 Datacenter Zones (allowed & recommended)
- NEBS Datacenter Zones (allowed & recommended)
- Optional Process Directional Arrowheads on Process Lines
- Ability to Specify Weather Plot Data Point Colors
- Ability to Specify Weather Plot Data Point Size
- Ability to Hide State Point Label on a Point-By-Point basis
- Draw Your Own Lines Anywhere You Want
- Draw Your Own Ellipses Anywhere You Want
- Draw Your Own Rectangles Anywhere You Want
- Draw Your Own Circles Anywhere You Want
- Insert Your Own Pictures Anywhere You Want
- Humidity Ratio Unit of Measure Control
- Mouse Cross-Hair (Like CAD!!) or Target Control
- Cooling Coil Performance Line Control
- Page Color Control
- Chart Area Color Control
- Black & White <=> Color Display & Print Control
- Heading On/Off Control
- Outline On/Off Control
- Zoom Window Control
Data Exchange
- Point Color Control when Importing Data from Excel (*.csv) files
- Point Size Control when Importing Data from Excel (*.csv) files
- Process Line Color Control when Importing Data from Excel (*.csv) files
- Process Line Thickness Control when Importing Data from Excel (*.csv) files
- Import Your Own Weather Data File Locations into the Chart
Additional Capabilities
- 20 Different Languages on Charts and Reports with one button click
- Note displaying capabilities
- Apparatus Dew Point (ADP) to Cooling Coil Leaving Air Calculator
- Air Bypass Factor (ABF) to Cooling Coil Leaving Air Calculator
- Point property toolbar display includes units of measure
- Thermal Comfort Terms Definition PDF Manual
- Air Density Property Calculation
- High Pressure Capability up to 100 PSI
- Auto-Altitude Change with Climatic Location Selection
- Fog Region Thermo-Physical Property Display